
Useful views for the teams making workplace decisions
Use the same underlying workplace data to answer different planning and operational questions.
For CEOs
Strategic visibility into how your most valuable assets are being utilized
For CFOs
Quantifiable ROI and cost optimization through data analysis
For Facility Managers
Operational efficiency and evidence-based space management
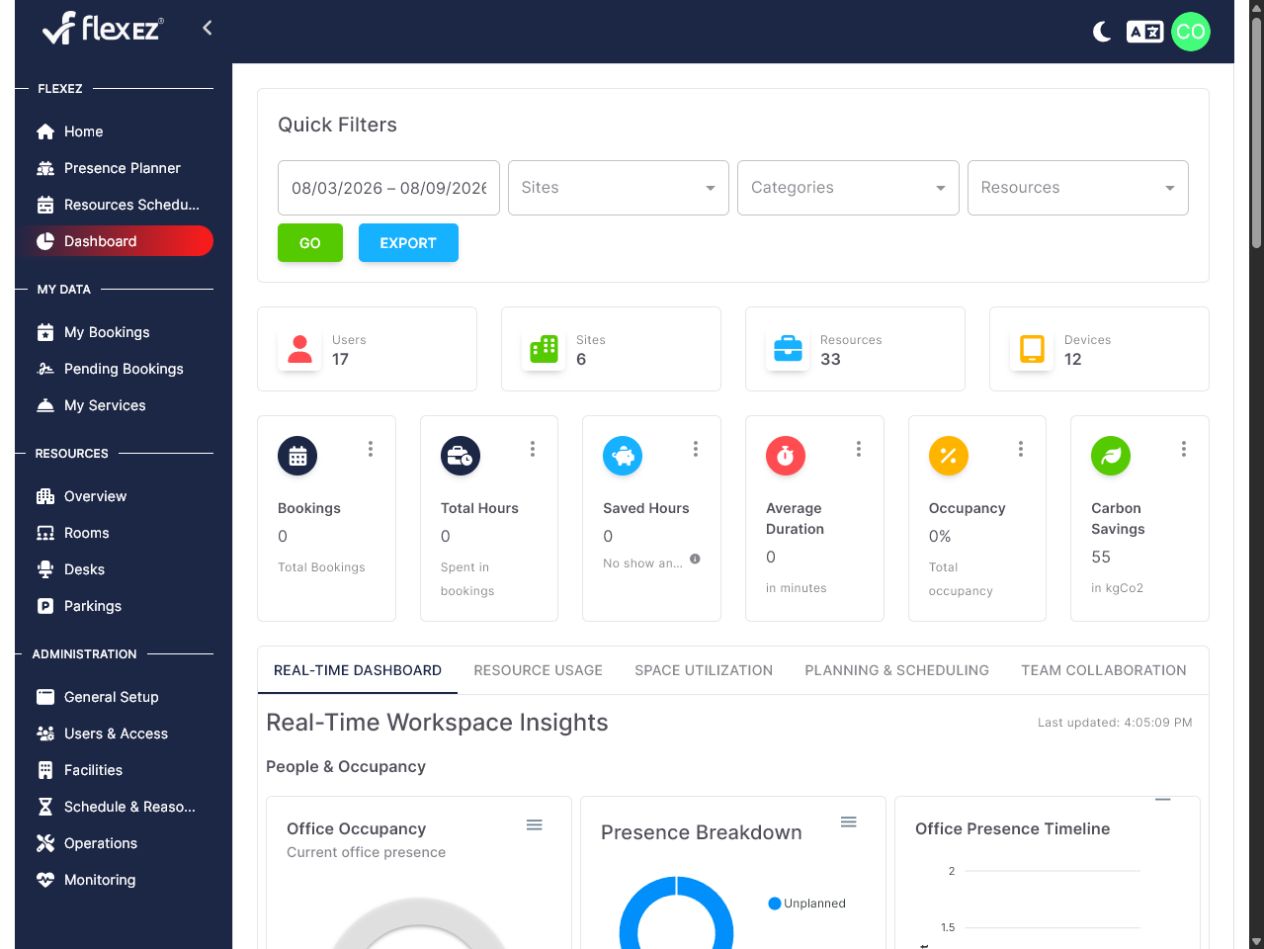
Example dashboard metrics
Illustrative metrics show the kinds of booking, presence and resource data flexEZ can make available; values depend on each deployment.
Total Bookings
Meeting reservations across all spaces
Hours Utilized
Total time spaces were actively used
Saved Hours
Efficiency gains from no-shows and early finishes
Avg. Duration
Average length of meetings and reservations
Occupancy Rate
Percentage of available space being utilized
Carbon Savings
CO₂ reduction from optimized space usage
Real-Time Workspace Intelligence
Live insights into how your spaces are being used right now
Live Office Presence
Real-time count of employees currently in the office
Presence Breakdown
Department and team distribution of in-office staff
Presence Timeline
Morning and afternoon patterns of office attendance
Resource Utilization
Current usage rates of workspaces, rooms, and amenities
Next Hour Forecast
Predicted space needs based on historical patterns and bookings
Remote/Office Trends
Comparative analysis of work location preferences over time
Team Collaboration Analytics
Insights into how teams work together and utilize spaces
Team Presence Synchronization
Measure how well teams coordinate in-office presence
Meeting Composition
Analysis of internal vs. external meetings and participant mix
Collaboration Matrix
Visualization of inter-team interactions and collaboration patterns
Data Export & Integration
Flexible options to connect with your existing tools and workflows
BI Tool Integration
Export data to PowerBI, Tableau, and other business intelligence platforms
API Access
Connect our analytics to your existing enterprise systems and workflows
Implementation Options
Choose the approach that best fits your organization's needs
flexEZ workplace platform
Implement booking, presence, resources and analytics together for a connected workplace data model.
Analytics-Only Implementation
Connect directly to existing calendar systems for basic analytics
Custom Analytics Development
Tailored solutions for your unique business requirements
Bespoke Metric Development
Custom indicators designed for your specific business goals
Specialized Dashboards
Tailored visualizations that match your reporting needs
Integration Consultancy
Expert support connecting with your existing systems
Real-Time Data Processing
Instant insights powered by live data processing capabilities
Live Data Streams
Continuous processing of occupancy and utilization data
Instant Updates
Dashboard refreshes in real-time as conditions change
Immediate Alerts
Notifications triggered by predefined conditions or anomalies